

If you have some data to visualize, making a spreadsheet in Google Sheets is a good start. However, making a graph in Google Docs should be your next option.
As you may know, Google Docs is a popular free web-based application available to users worldwide which allows users to create documents and spreadsheets.
It is an online word processor that is fully compatible with Microsoft Word and it enables you to add functionality with Google Chrome extensions.
With Google Docs there’s ease of collaboration, you get access to your work from any device, it has automatic saves and most importantly, it’s free.
The benefits of using Google Docs goes on and on, however, most users limit its use to creating simple documents and at seldom times, spreadsheets. Other than these features, you can also make charts using Google Docs.
Selection of Charts in Google Docs
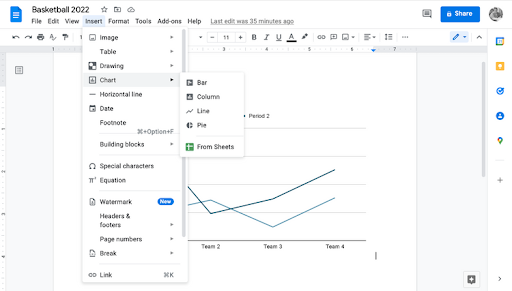
There are four popular different types of charts built right in Google Docs. These are:
- Bar
- Column
- Line
- Pie
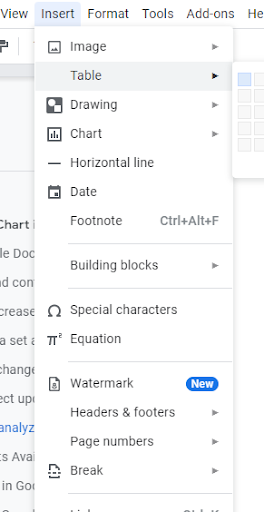
If a table is a better fit for your needs? You can do so by going to the toolbar and selecting Insert > Table.

How to Create a Chart in Google Docs
If you want to visualize your data using a chart in Google Docs, it’s quite simple. However, you can only make charts in Google Docs using a browser, not a mobile device.
The browser version of Google Docs has a simple chart creation tool built right in. Here, we’ll go over the fundamentals of quickly creating and editing these charts.
- Open and create a new document
- Then choose Insert > Chart from the toolbar.
- Choose from a variety of chart types, or choose From Sheets to identify a chart you’ve previously generated in Google Sheets.
- The chart will display inside your Google document once you’ve made your choice.

Edit a Chart in Google Docs
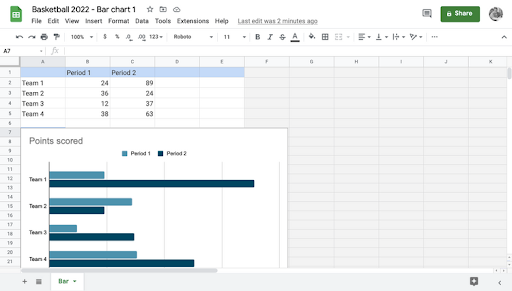
Within Google Docs, you can’t change the chart. Instead, you’ll need to use Google Sheets to change the data within the chart. To do so, follow these steps:
- Choose a chart. Then, in the top right corner, select the dropdown option.
- Choose Open source. The Google Sheets application will launch.
- Use the appropriate cells to enter the data you want to see in your chart.
- Return to Google Docs and select <Update next to the dropdown option when you’re through editing your data.
By selecting Image Options from the toolbar, you can also change the color of your chart and other options.
Google Docs is much more than a document creator. It allows you to compare and contrast multiple data sets, visualize data set growth and declines, and give project updates, among other things.
Uses for Google Docs Charts
The possibilities for using the charts in Google Docs are practically unlimited. You can make charts to visualize anything, whether it’s for work or fun.
-
Compare and contrast different data sets.
In mathematics, science, and even everyday life, comparing datasets is a crucial skill. People are frequently faced with decisions about how to compare the health efficacy of various treatments, the relative costs of goods and services, the best investment options and many more.
-
Visualize increases or decreases in data sets
Charts help you visualize increases and decreases in data sets. Because it helps humans comprehend better, uncover patterns, detect outliers, and draw actionable conclusions, data visualization can make it easier to convey and evaluate difficult-to-understand data, making it a key tool in business.
-
Express data set as a percentage of the total number of data sets.
Expressing data sets as a percentage of the total number of datasets aid readers in comprehending study topics, maintaining their interest, and successfully presenting big amounts of complex information.
-
Show data changes over time.
Datasets percentages are essential for the advancement of numerous computational domains, providing results with scope, robustness, and confidence.
-
Deliver project updates
Reports are, without a doubt, the most useful tool available to project managers and stakeholders. Google Docs Charts help make tracking, cost management and identifying risks easier.
-
Obtain and analyze feedback
Customers’ demands and complaints are identified through feedback analysis, allowing firms to improve customer happiness and reduce churn.
-
Distribute infographics
Using visual data such as charts make it easier for individuals to assimilate information. By using Google Docs Charts, information can be converted into memorable, attention-grabbing graphics or even be used as good infographics.
Generally, the uses of charts in Google Docs are limitless and a chart is the finest solution for presenting facts in a visually pleasing manner.